
Business Intelligence
Turn Complex Business Data Into Clear Decisions
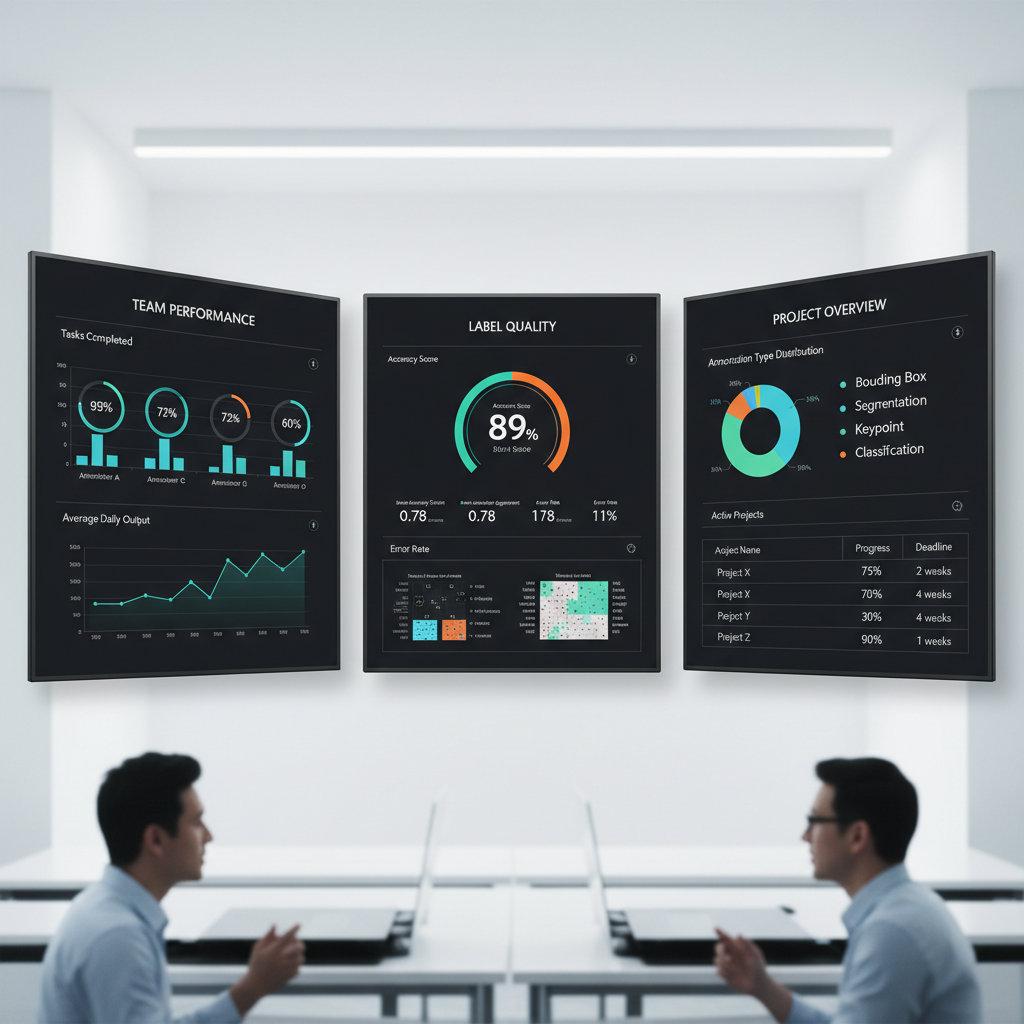
We design and build interactive dashboards, KPI reports, and analytics systems that give leadership teams clear visibility into sales, financial performance, operations, and business health — without waiting for manual reports.
Dashboard Platforms
Dashboards Built for Your Platform
We work with the leading business intelligence platforms and select the right tool based on your existing technology and reporting requirements.
Power BI
Microsoft ecosystem integration
Interactive Power BI reports and dashboards connected to your data sources — from SQL databases and Excel files to cloud platforms and APIs.
- Real-time data refresh
- Row-level security
- Mobile-optimized reports
- Embedded analytics
Tableau
Visual analytics and exploration
Tableau dashboards built for business users who need to explore data visually, identify trends, and share insights across the organization.
- Advanced visualizations
- Calculated fields
- Dashboard actions
- Published to Tableau Server or Cloud
Looker Studio
Google ecosystem reporting
Looker Studio reports connected to Google Analytics, Google Ads, BigQuery, Sheets, and other Google Workspace data sources.
- Google data native
- Shareable reports
- Automated data blending
- Free to access
Excel Reporting
Advanced spreadsheet systems
Advanced Excel models, automated reports, pivot dashboards, and structured workbooks that replace manual data compilation.
- Automated data pulls
- Dynamic pivot tables
- Custom formulas
- Macro automation
Custom Dashboards
Built-in web applications
Custom web-based dashboards built with React and Next.js, connected to your databases — for teams that need a fully tailored experience.
- Fully custom design
- Role-based access
- Live database connection
- Any data source
Use Cases
What We Build Dashboards For
Every dashboard is designed around the specific decisions your leadership team needs to make.
Sales Analytics
Track pipeline, conversion rates, revenue by rep, product, or region. Identify what is working and where deals are stalling.
Financial Analytics
Profit and expense analysis, budget vs. actuals, cash flow visibility, and financial performance reporting for leadership.
Operations Reporting
Operational KPIs, process performance, inventory status, and resource utilization — all in one place.
Executive Dashboards
High-level KPI views designed for leadership — combining data from multiple departments into a single performance snapshot.
Tools & Technologies
The Right BI Tool for Your Business
We select the best platform based on your existing technology stack, team size, data sources, and reporting requirements. The goal is always a solution your team will actually use.
Ready to Get Started?
Build Your First Dashboard
Book a consultation and describe your reporting needs. We will recommend the right dashboard platform and scope a solution for your business.